
WaterSmart Dams - Making Dams Work Again
Timeframe: July 2022 - June 2025
Funding Source: Future Drought Fund and DPIRD (Project led by Grower Group Alliance, UWA and DPIRD)
Project Coordinators: Carrie Taylor, Maddy Wylie
Summary: The project will involve 12 core demonstration sites, building farm-based water planning tools, workshops, field days and industry training. The project will investigate solutions including renovating existing dams, building new dams, and implementing evaporation suppression and runoff technologies.This two year project aims to develop knowledge and water planning tools for farmers who need their dams to work in all years, and be able to make water investment decisions with confidence.
Project Partners & Leads: The GGA through the South-West WA Drought Resilience Adoption and Innovation Hub, will collaborate with the Department of Primary Industries (DPIRD) and the University of Western Australia (UWA), leveraging their existing work and prior investment in this field as well as four grower group project partners including Compass Agricultural Alliance (Darkan), Southern Dirt (Kojinup), Merredin and Districts Farm Improvement Group (Merredin) and the Fitzgerald Biosphere Group (Jerramungup).
Funding Source: WaterSmart Dams builds on the existing WaterSmart Farms program – a collaborative DPIRD designed program researching sustainable groundwater supply options using on-farm desalinisation technology.
This project is jointly funded through Australian Government’s Future Drought Fund (FDF) and the Department of Primary Industries and Regional Development (DPIRD).
The project can be followed here.
Our Demonstration Sites:
Stay tuned for further updates on monitoring results!
Dam/catchment design and evaporation suppression, hosted by the Jones family in Gairdner.
An existing key dam has been enlarged to better capitalise on its large, roaded catchment. A Daisy dam cover has also been installed to reduce evaporation. Water level loggers and a weather station have been installed at the site to measure evaporation loss and provide data for an economic analysis which will assess $/kl water savings/costs, in order for growers’ to determine the viability of this option for their own property.
Head to the Daisy Dam Cover FAQ page for more information about their covers, including installation and lifespan.
The dam measurements are as follows:
North edge 27 metres
South edge 30 metres
East edge 36.5 metres
West edge 39.5 metres
The size of the catchment is about 0.75ha.
The cover consists of eight 10m x 5.25m modules, and four 5.25m x 5.25m modules; giving a total covered area of approx 530.25 m²and and allowing for adjustments as dam levels rise and fall. The total cost of the cover (including freight) was $9,257.69, equating to around $17/m²; significantly cheaper than other options on the market, which reach upward of $50/m².
A standpipe has been installed at the dam, with additional tanks (including a gravity fed tank onsite) also on the cards (grower funded). Metres will be installed on the pipes to measure demand from the dam.

Installing the Daisy dam cover at Jones’ Gairdner property, in September 2023
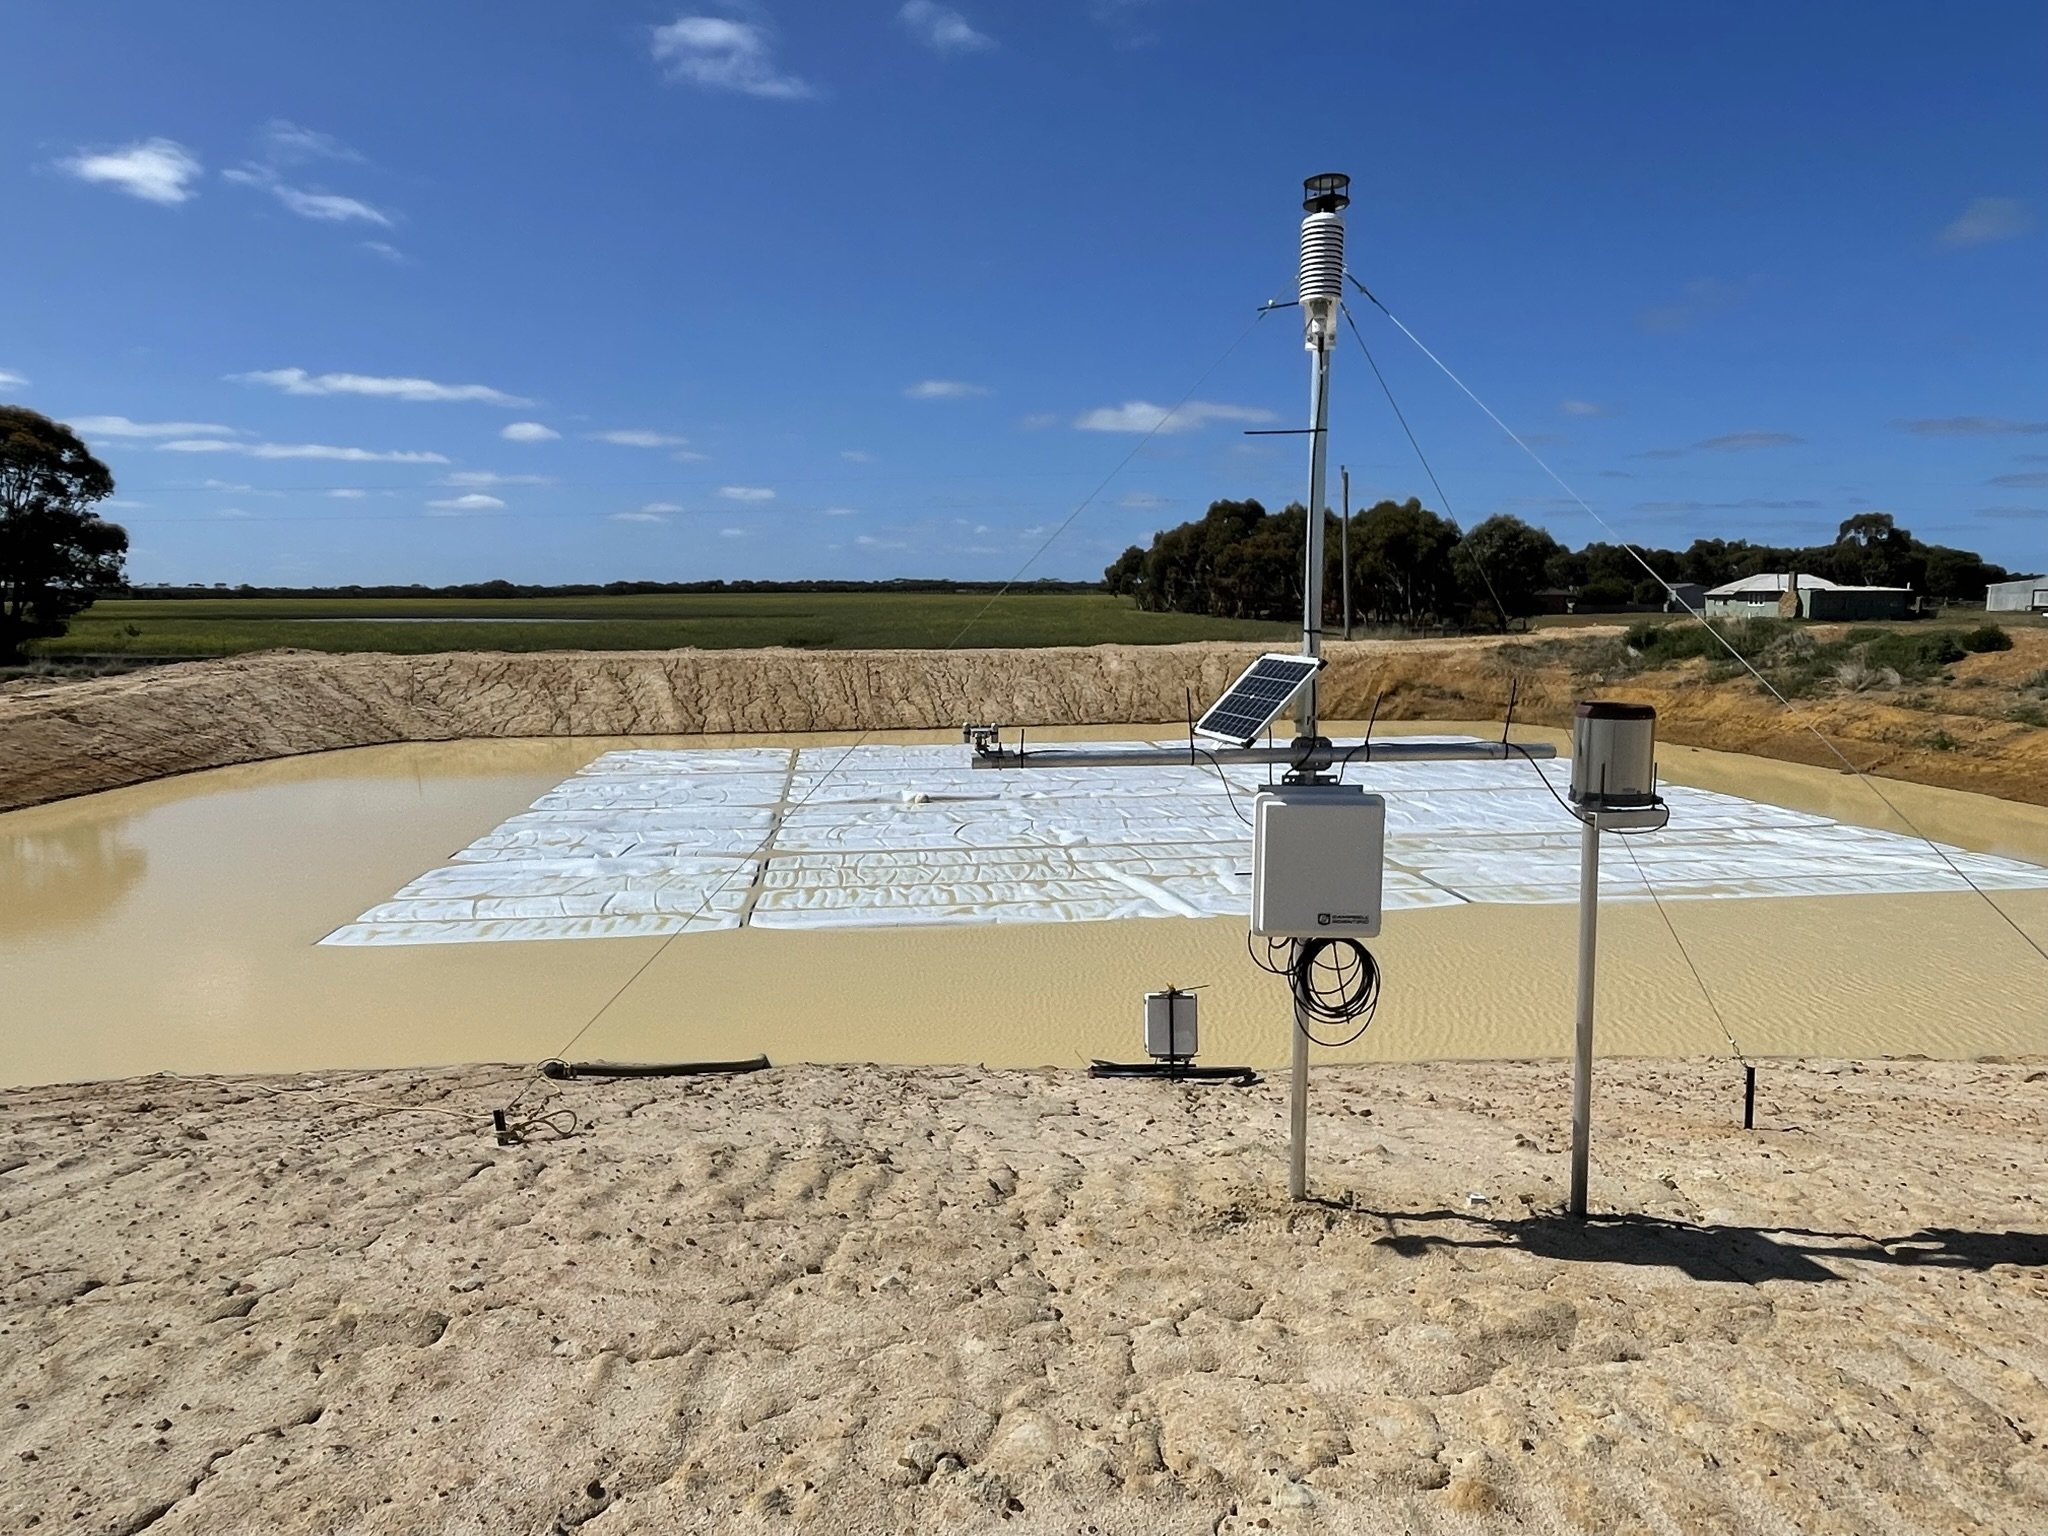
The completed weather station, logger, and cover install.

An aerial view of the dam, cover, and catchment (photo by Brianna Jones).
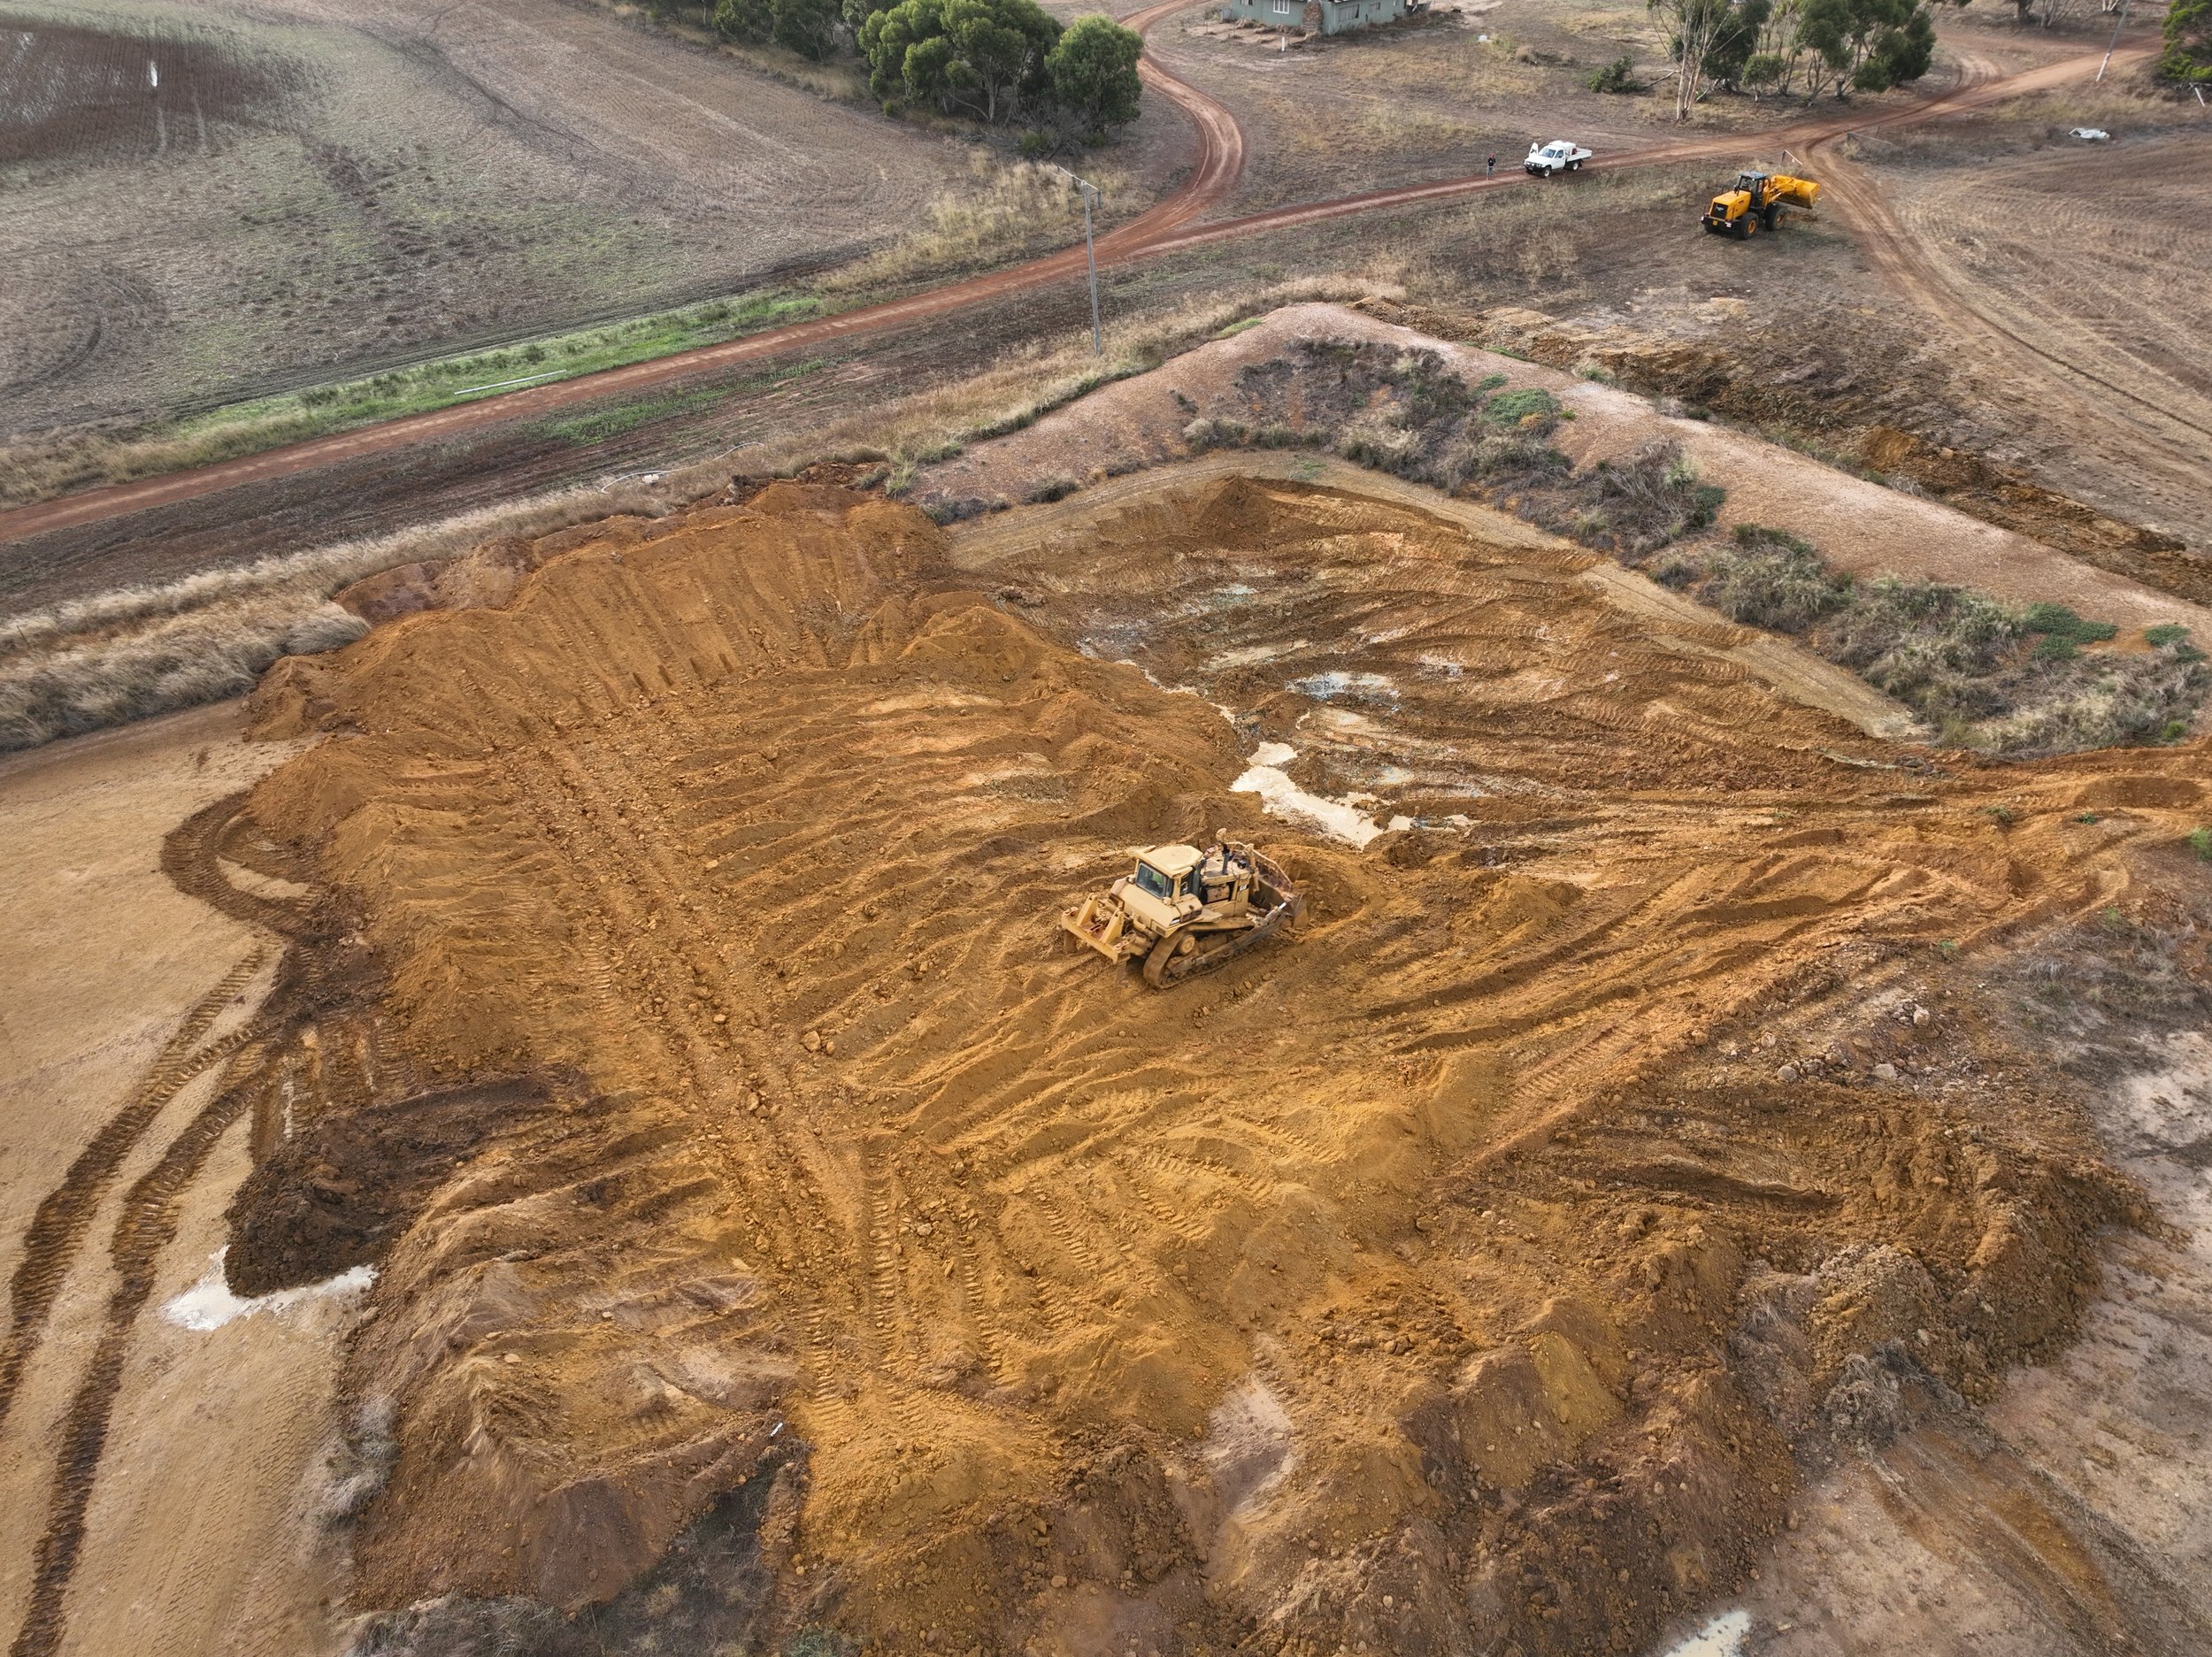
Resizing the dam to better suit the existing catchment.
2. Using secondhand CBH tarps to increase catchment efficiency, hosted by the Lester family* in Jacup.
*The Jacup community dam is also a Strategic Community Water Supply Site, maintained by DWER.
Eighteen secondhand (~7 years old) CBH tarps have been used to line a dam catchment in order to increase the run-off thresholds. Tarps were sewn together onsite and the edges were buried under the shoulders of the catchment. The structure is designed to handle 20mm/hour event without exceeding the dam’s capacity, hence the tarped area being smaller than the entire existing catchment area. The following equations were considered when contemplating these run-off thresholds….
Supply into xxx volume earthen dam from xxx size catchment
Annual rainfall -evaporation & loss X catchment area = expected yield volume into dam
Monitoring equipment has been installed at the bottom of the catchment to quantify rainfall and run-off. Early data suggests run-off is being captured from ~0.8mm rainfall events, at intensities as low as 2-3mm/hour. For comparison, good roaded catchments run off around 8mm, while HDPPE plastics run off 0.25mm.
Micro-plastics sampling is underway (water + sediment). This monitoring will include before, during, and after samples.
Tarps are being monitored for degradation. So far, a number of small holes have been located and repaired; one of which causes some ballooning effects which were rectified as soon as the hole was repaired. Other than this, the tarps are so far proving to be very stable even in very windy weather.

The tarp-lined catchment from above